|

Graphs 
Graphs are scene objects that can record and visualize data from a simulation. Data is recorded in data streams, which are sequential lists of values associated with time stamps.
Data streams can directly be visualized as time plots. By combining 2 or 3 data streams, one can obtain x/y curves, or 3D curves in the scene.
Following figure illustrates a time plot, showing 6 data streams visualizing joint velocities:
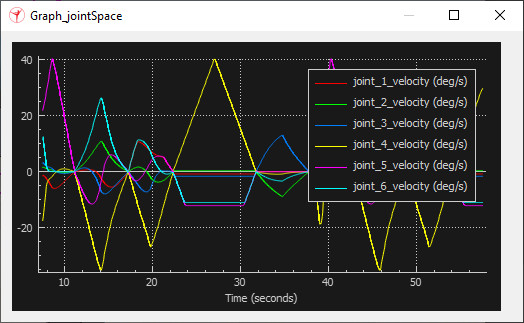
[Examples of a time plot]
A graph is added to the scene with [Menu bar --> Add --> Graph]. Its basic properties are accessed and adjusted in the graph dialog.
The user is in charge of defining data streams, curves, and feeding them with appropriate data on a regular basis (usually once per simulation step). Following illustrates how to record and visualize 2 data streams (the velocity of two joints over time):
function sysCall_init()
    graph=sim.getObject('/Graph')
    joint1Vel=sim.addGraphStream(graph,'joint 1 velocity','deg/s',0,{1,0,0})
    joint2Vel=sim.addGraphStream(graph,'joint 2 velocity','deg/s',0,{0,1,0})
end

function sysCall_sensing()
    sim.setGraphStreamValue(graph,joint1Vel,180*sim.getJointVelocity(joint1Handle)/math.pi)
    sim.setGraphStreamValue(graph,joint1Vel,180*sim.getJointVelocity(joint1Handle)/math.pi)
end
Next example shows how to record and visualize an x/y position curve of an object:
function sysCall_init()
    graph=sim.getObject('/Graph')
    objectPosX=sim.addGraphStream(graph,'object pos x','m',1)
    objectPosY=sim.addGraphStream(graph,'object pos y','m',1)
    sim.addGraphCurve(graph,'object pos x/y',2,{objectPosX,objectPosY},{0,0},'m by m')
end

function sysCall_sensing()
    local pos=sim.getObjectPosition(objectHandle,-1)
    sim.setGraphStreamValue(graph,objectPosX,pos[1])
    sim.setGraphStreamValue(graph,objectPosY,pos[2])
end
See also the API functions related to graphs.
|